Articles
FICO Safe Driving Score Predicts Likelihood of Future Collisions
Originally published in FICO 04/07/2019

By Can Arkali
Despite advancements in safety technology, road fatalities are on the rise. Per the National Highway Traffic Safety Administration, human error accounts for 94% of crashes. FICO, along with global risk management leader, eDriving, firmly believes that proper education and reinforcement of safe driving behaviors can help make roads safer and potentially save lives, including for fleet drivers of all types of vehicles, driving for varied work purposes in all types of conditions, and others.
Pertinent data and prudent application of predictive analytics can provide insights into helping identify and reinforce safe driving behaviors.
FICO launched the FICO® Safe Driving Score in partnership with eDriving’s smartphone application, MentorSM in October 2016. Since then, the underlying model and application have both been fine tuned to the specific needs and requirements of Fleet Safety Management programs and adopted by global industry leaders with fleets of tens of thousands of drivers in service, delivery, and sales sectors.
The FICO® Safe Driving Score leverages telematics-based driving data provided by Mentor to predict the likelihood of future driving incidents by evaluating driving behaviors, such as acceleration, braking, cornering, speeding and cellphone distraction. Designed to be at the heart of the Mentor smartphone application, the FICO® Safe Driving Score provides a driver’s risk score after each valid trip and over time. The higher the score, the more likely a driver is to display safe driving behaviors and to avoid collisions in the future.
Providing a consistent and objective measure of driver risk and safety based on driving behaviors, the FICO® Safe Driving Score is poised to become the industry standard for predicting driver risk.The FICO® Safe Driving Score offers a significant level of transparency and insight which is shared with drivers who use Mentor on an opt-in basis, wherein location data is shared only with the driver. This provides drivers with actionable insights into what specific driving behaviors they need to demonstrate to improve their scores or to maintain current high-level scores.
Our most recent analytic effort validated the ability of the FICO® Safe Driving Score to predict drivers’ propensity to be in a collision using data from an independent sample of drivers. In this effort, we leveraged naturalistic driving data from a third-party research study, the 2ndStrategic Highway Research Program (SHRP2), spanning three years, 3,000 drivers and over 30 million miles driven (Dataset 10.15787/VTT1/IEKRD3).*
We designed the FICO® Safe Driving Score to zoom in on these key dynamics between various driving behaviors and their relation to subsequent collisions. Most importantly, in the preponderance of cases we examined, we have been able to demonstrate that drivers identified by the FICO® Safe Driving Score as being higher risk for having future collisions are, indeed, more likely to incur a collision in the future than those identified as lower risk.

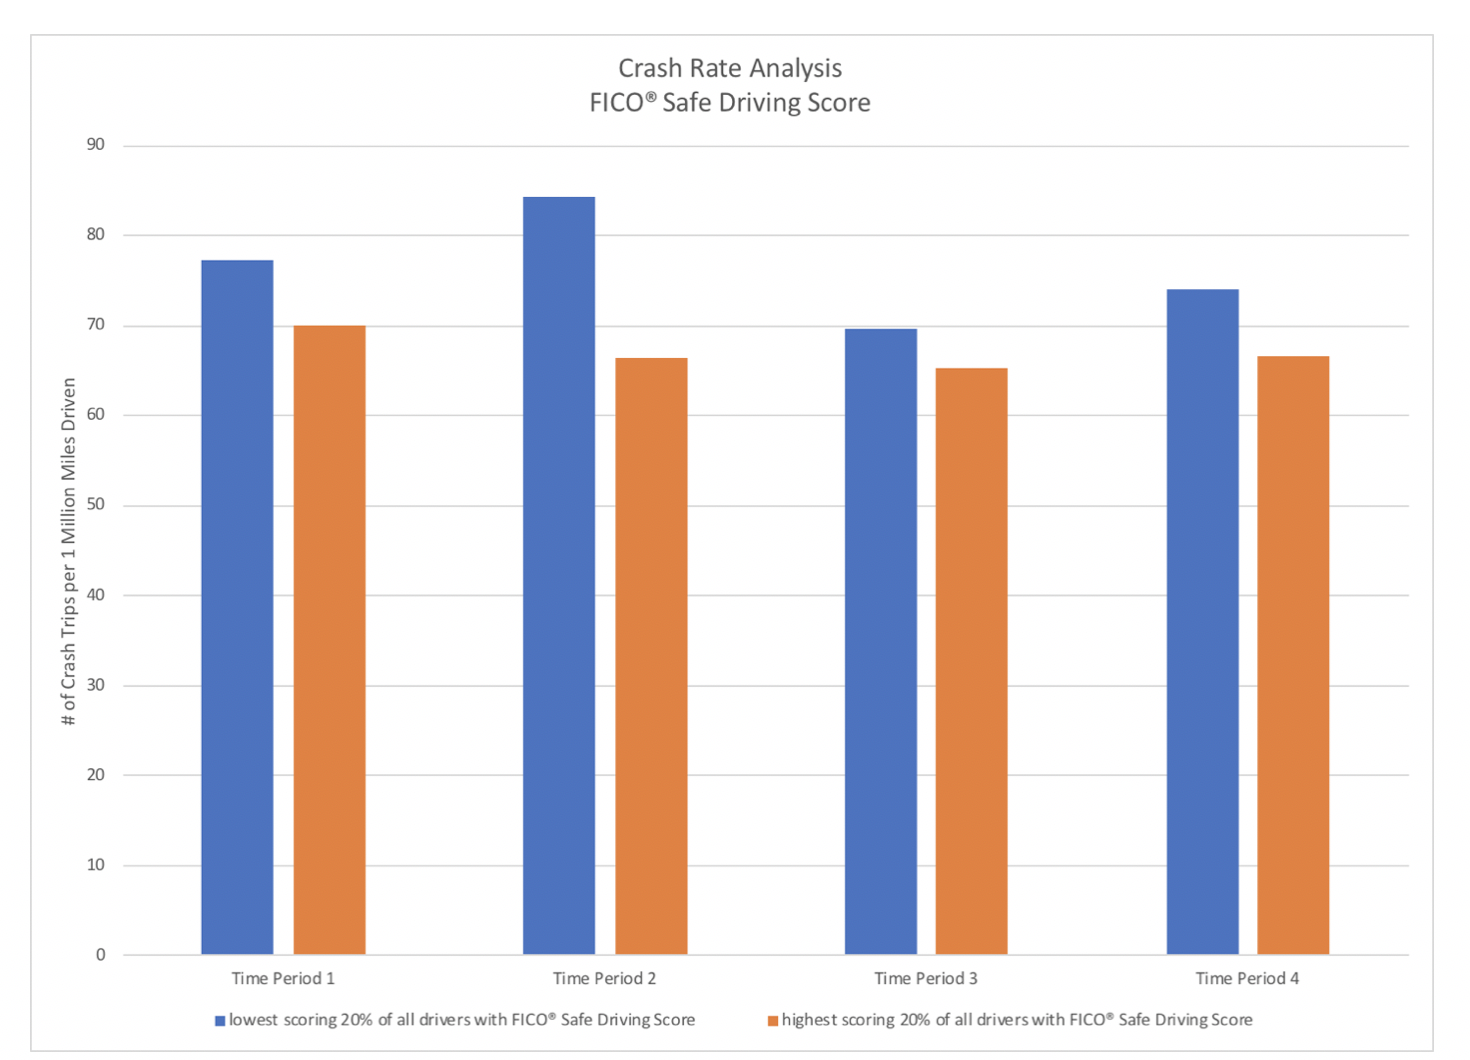
As this chart illustrates, the lowest scoring 20% of drivers are up to 30% more likely to have a collision in the future than the highest scoring 20% of drivers.
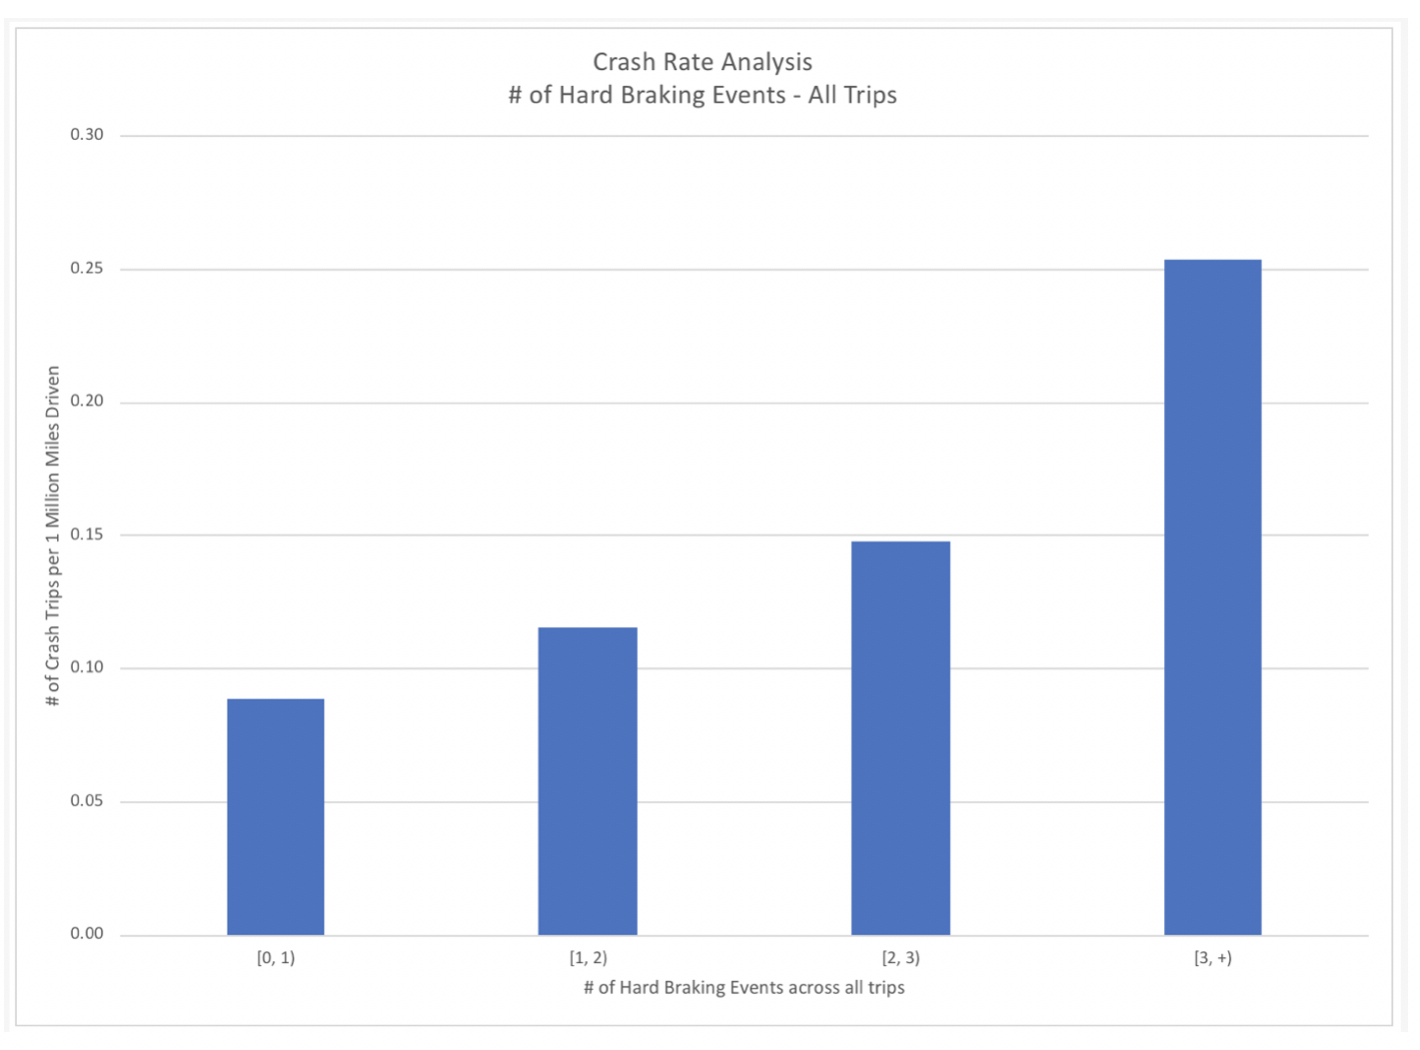
Furthermore, our analysis has concretely verified the assumption that unsafe driving behaviors, such as hard braking events, are correlated with higher risk of future collisions.

As the above chart demonstrates, trips with three or more hard braking events are more than 2.5 times more likely to result in a collision than those with no such events.
Our analysis to date has offered very solid evidence of the efficacy of the FICO® Safe Driving Score in predicting future collisions. And, yet, there is an opportunity to continue to build on this strong foundation. Predicting future collisions based on telematics-based driving data alone is challenging – the data can be noisy even within a somewhat “controlled” environment; the behaviors can vary based on extraneous events such as weather, traffic flow, or even mood of the driver; and connecting the telematics-based driving data to the outcome (collisions, losses, etc.) can be expensive and takes time. In spite of these challenges, the analysis of the SHRP2 data has provided significant insights that we will leverage to continue to improve the FICO® Safe Driving Score modeling, giving Fleet Safety Managers even more powerful tools to help their employees return home safe to their families every night.
*The findings and conclusions of this paper are those of the author(s) ad do not necessarily represent the views of VTTI, the Transportation Research Board, or the National Academies.”